UPSC: Is there a disparity between Muslim, non-Muslim candidates? Data scientist explains with help of graphs

By Team MyNationFirst Published Sep 17, 2020, 7:01 PM IST
Highlights

Sanjeev Newar, a data scientist has put out a series of tweets, explaining how Muslim aspirants have got greater marks compared to aspirants of other religions with the help of graphs
 

Bengaluru: There is a hue and cry over a TV show by Sudarshan TV. Many cried foul that the programme targeted Muslims in the UPSC and even approached the Supreme Court and successfully manged to bring a stay on it. 

As reported by a popular website, the show - UPSC Jihad - focuses on certain very specific aspects – mainly, the undue advantage to Muslim candidates and the infiltration of problematic organisations like the Zakat Foundation, which, per the show, receives funds from terrorist organisations.

The matter is still sub-judice. 

However, Sanjeev Newar, a data scientist has put out a series of tweets, explaining how Muslim aspirants have got greater marks compared to aspirants of other religions with the help of graphs. 

After huge demand, giving you distribution plots of interview (personality) & written marks in UPSC. First image is for interview marks in 2018. As clearly seen, marks of M (blue) are clearly shifted by around 10 marks higher from non-M (orange) candidates. Isn't it interesting?+ pic.twitter.com/cOiWOQO3FS

— Sanjeev Newar संजीव नेवर (@SanjeevSanskrit)


He then talks about the written marks: 

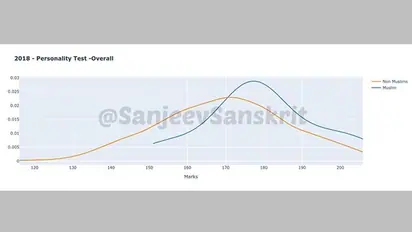
“The written marks of 2018 have more interesting pattern. M marks (blue) show perfect bell curve (actually too perfect for small sample). But non-M marks (orange) seem as if half of candidates' have marks pulled towards lower to balance for higher marks of top half of candidates.+” 

The written marks of 2018 have more interesting pattern. M marks (blue) show perfect bell curve (actually too perfect for small sample). But non-M marks (orange) seem as if half of candidates' have marks pulled towards lower to balance for higher marks of top half of candidates.+ pic.twitter.com/wewTE6TDis

— Sanjeev Newar संजीव नेवर (@SanjeevSanskrit)


After the written marks of 2018, the next observation put out is about the year 2017. 

He says, “In 2017, interview marks show same trend but margin of difference between M and non-M is lesser. 2016 has a bit uneven marks pattern for non-M but a smooth curve for M. Interesting!+”

In 2017, interview marks show same trend but margin of difference between M and non-M is lesser. 2016 has a bit uneven marks pattern for non-M but a smooth curve for M. Interesting!+ pic.twitter.com/cW51DG9vgq

— Sanjeev Newar संजीव नेवर (@SanjeevSanskrit)


The comparison between the two: 

He adds, “If we compare written marks for 2017 and 2016, they are close. I won't infer much given the sample size difference in M and non-M candidates. So instead of being too finicky, I would say they are broadly same.+”

If we compare written marks for 2017 and 2016, they are close. I won't infer much given the sample size difference in M and non-M candidates. So instead of being too finicky, I would say they are broadly same.+ pic.twitter.com/wNfCnvlpsN

— Sanjeev Newar संजीव नेवर (@SanjeevSanskrit)


Here’s a note on how Muslims outperformed non-Muslims every year. 

“Note that this is what data shows. Why this is happening is not something data can suggest with this info. However I did plot category wise interview marks to see if story is different. But what I found was that for each of OBC and General, M still outperformed non-M every year+” 


He also goes on to provide charts for written performance over the years. 

Note that this is what data shows. Why this is happening is not something data can suggest with this info. However I did plot category wise interview marks to see if story is different. But what I found was that for each of OBC and General, M still outperformed non-M every year+ pic.twitter.com/3rronu3mnS

— Sanjeev Newar संजीव नेवर (@SanjeevSanskrit)

“I would also provide charts for written performance over years. I leave it to people to bring out inferences. What is important though is that on average OBC non-M seem to be having biggest shortfall compared to OBC M in interviews. It was 10.07 in 2018 and  9 in 2016.”

I would also provide charts for written performance over years. I leave it to people to bring out inferences. What is important though is that on average OBC non-M seem to be having biggest shortfall compared to OBC M in interviews. It was 10.07 in 2018 and 9 in 2016. pic.twitter.com/2wBl6fpMEE

— Sanjeev Newar संजीव नेवर (@SanjeevSanskrit)


Read Exclusive COVID-19 Coronavirus News updates, at MyNation.

tags
click me!